- Colorectal cancer (or CRC) is the third most deadly & fourth most commonly diagnosed cancer in the world
- CRC incidence rising worldwide -> in developing countries with more ‘Western’ diets
- In countries undergoing many developments -> higher incidences with increasing human development index (HDI)
- Does this take into account completeness and effectiveness of cancer registries/databases, screening, and behaviors such as reporting?
- In countries undergoing many developments -> higher incidences with increasing human development index (HDI)

- Risk factors/behaviors
- Obesity
- Diabetes
- Family history/hereditary disorders
- Inflammatory bowel diseases
- Ulcerative colitis + Crohn’s disease -> affect people with lower income and educational status the worst
- Sedentary lifestyle
- Red/processed meat consumption
- Alcohol, tobacco
- Reducing CRC mortality -> early detection screenings, treatment options, genetic testing, family history documentation
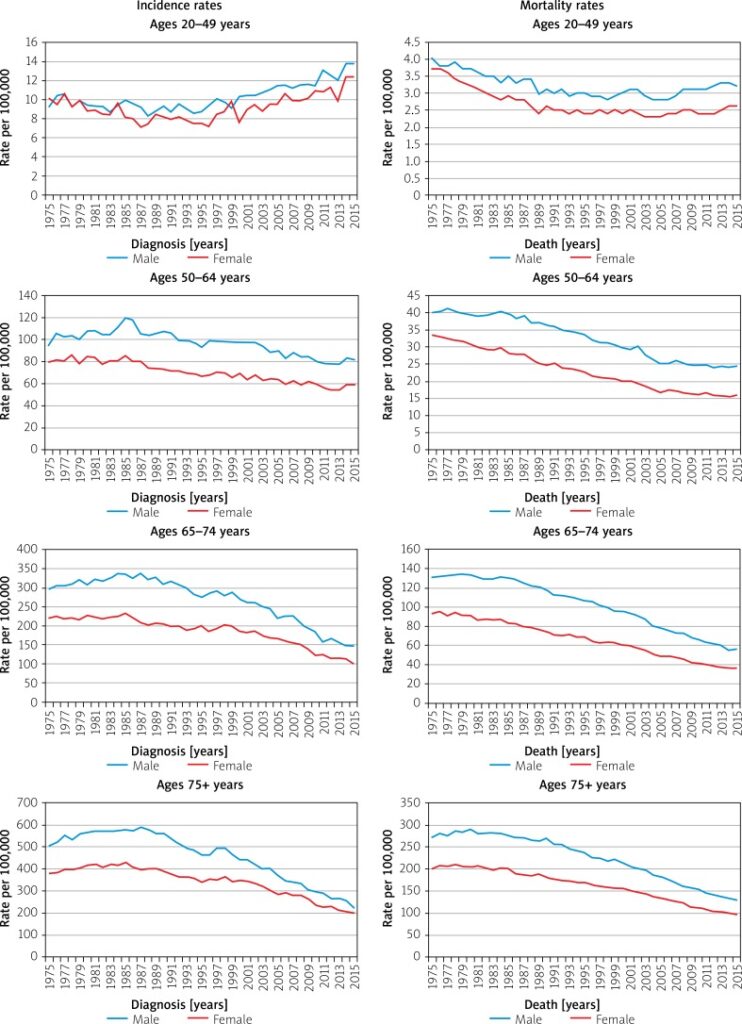
- More incidence among men than women
- (Why?)
- Is this age-related incidence rising only happening to CRC or to other cancers as well?How are we documenting this?
Survival
- Decreases in mortality could be due to early detection screenings and efforts (removal of polyps, colonoscopies, blood testing)
- Five year survival rate depending on stages
- Stage 1: 92%
- Stage IIA: 87%, stage IIB: 65%
- Stage IIIA: 90%, stage IIIB: 72%, stage IIIC: 53%
- Stage IV (metastatic): 12%
- Why are rates for stage IIIA and IIIB higher than the stage II?
- Survival varies depending on race and status
- Up to 30% of CRC patients have family history of neoplasm
- Lynch syndrome and other hereditary risk factors -> genetic diagnosis are too costly -> family history remains in data-taking -> will this be effective in populations w/o access to care and consistent history-taking? (i.e rural populations lacking specialists/ PCP)
More on Race

-> Observation: racial identification/categorization in the above graph is unclear and confusing. This resonates with How Cancer Crossed the Color Line and its analysis of inconsistent demographic and racial categories in databases which influence statistics. In what way do numbers and statistics of cancer influence ontology? Historically race categorization has been fluid depending on the social views accepted at the time -> what are some other ways to report demographical data better?
- African Americans and Native Americans have higher incidences of CRC and lower survival among all CRC stages
Prevention
- Screenings
- Behavioral modifications
- Diet: calcium, vitamin D, low-fat dairy, fibre, antioxidants -> reductions in CRC risk
- Use certain medications (NSAIDSs) have protective effects against CRC
- Reflections/questions:
- Necessity of numbers in epidemiological studies -> yet, are cancer patients suffering ‘violence by abstraction’? (Jain, Malignant)
- The Mortality Effect: immortal logic of science + data vs. individual mortality
- Statistical logic and its dangers
- Prognostic stats are at once transparent and confusing… it means everything and nothing at once, especially regarding survival
- Ontology of cancer through numbers and trends: We derive our treatment and knowledge off of data, but how much is this data hidden/skewed, and how does that affect the way we understand and perceive cancer?
- Fluid and ever-changing categorization of race as an example